Mapping Momentum Indicators Across International Soccer Markets for Line Value Detection
Gisela Lange · Aug 14, 2026
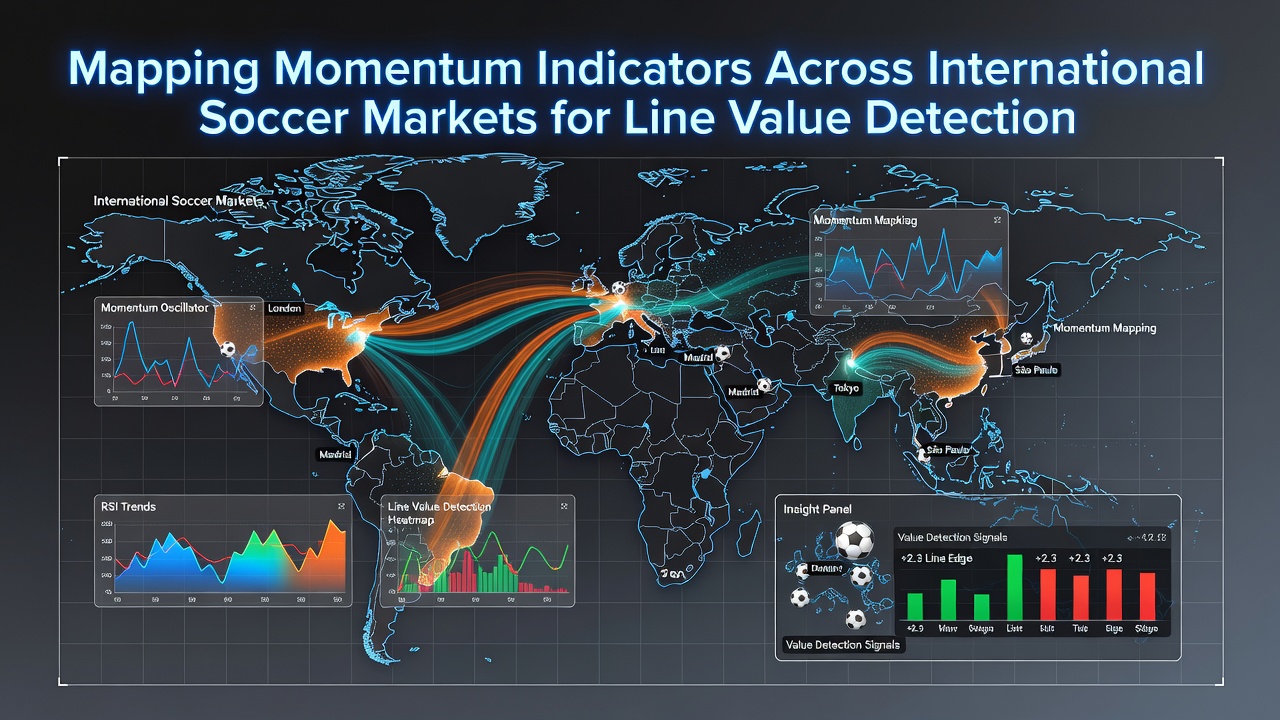
Mapping Momentum Indicators Across International Soccer Markets for Line Value Detection
Analysts track momentum indicators in soccer by examining sequences of results, goal differentials, and possession metrics that shift across matchdays in leagues from Europe to South America and North America. Data from the 2025-2026 season shows how these patterns help identify discrepancies between current betting lines and underlying team performance in markets such as match winners and over-under totals.
Defining Core Momentum Metrics in Soccer Contexts
Momentum builds through consecutive wins or strong underlying stats like expected goals and pass completion rates in the final third, while researchers collect information from sources including Opta and Wyscout to quantify these trends across competitions. European leagues such as the Bundesliga and Serie A display distinct patterns where rapid shifts in form occur after international breaks, whereas South American leagues like Brazil's Serie A often feature longer momentum stretches due to fixture congestion and travel demands.
Teams that sustain high pressing intensity for multiple matches create measurable edges, and observers note how these indicators appear in historical datasets from the 2024 World Cup qualifiers onward. August 2026 marks the start of new campaigns in several confederations where early-season data sets the baseline for momentum calculations before mid-season adjustments take effect.
Regional Variations in Indicator Application
European markets respond quickly to momentum changes because of high media coverage and liquidity, yet Asian betting markets sometimes lag on the same signals for leagues like the J-League or K-League. Studies from university research groups in Canada have examined how travel fatigue affects MLS teams during cross-conference stretches, producing momentum drops that betting lines adjust slowly in certain cases.
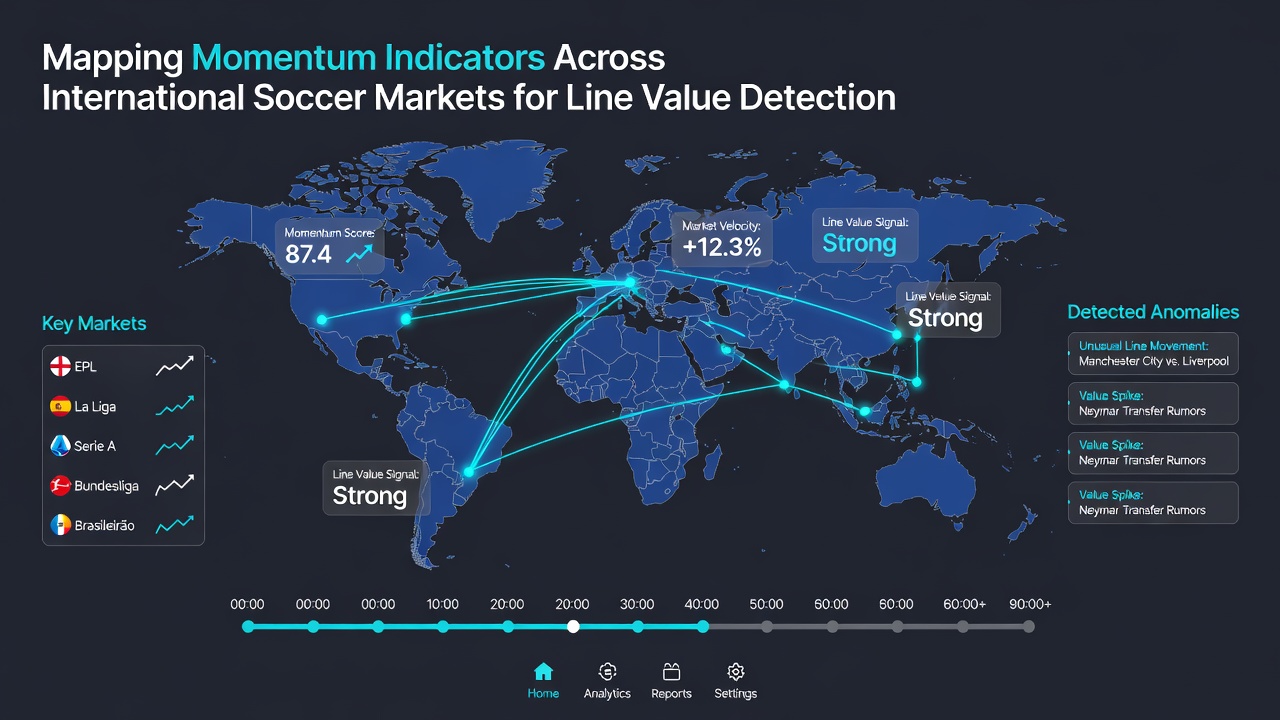
Analysts combine rolling averages of clean sheets and shots on target to create composite scores, then compare those against opening odds released by operators in different jurisdictions. One approach involves plotting recent performance curves against historical averages for clubs in the AFC Champions League, where momentum often accelerates during knockout stages.
Techniques for Detecting Line Value Through Momentum Mapping
Mapping involves plotting indicator values on timelines that align with fixture schedules, allowing detection when lines fail to reflect recent accelerations or decelerations in team output. Data aggregation from multiple confederations reveals that value emerges most often in matches between mid-table sides where public perception lags behind statistical momentum shifts.
Tools process variables such as set-piece conversion rates and recovery time after conceding goals, then flag instances where implied probabilities diverge from calculated expectations. August 2026 fixtures provide fresh datasets because several leagues resume after summer tournaments, creating windows where early momentum signals have not yet influenced market pricing.
Integration of Data Sources and Analytical Models
Models draw from league-specific repositories maintained by organizations like UEFA and CONMEBOL alongside academic papers published through sports analytics conferences. These inputs feed algorithms that weight recent results more heavily than older performances while accounting for opponent strength adjustments. Observers who apply these methods across continents report consistent identification of edges in both popular and secondary markets.
Cross-referencing with player availability reports adds another layer because injuries disrupt established momentum sequences in predictable ways. Researchers continue refining these mappings to handle variables such as weather impacts in northern European leagues during late summer periods.
Conclusion
Mapping momentum indicators supplies a structured method for examining soccer markets worldwide adn locating line value through systematic comparison of performance data against odds. Continued collection of metrics from diverse leagues supports more precise detection as datasets expand through the 2026 season and beyond.